Attendance Charts and Graphs
The idea for the following activity came from Gaye D'Agata, an Adult Ed teacher in Rochester, NH. This activity provides the students with lots of real data with which they can answer a slew of GED-type questions.
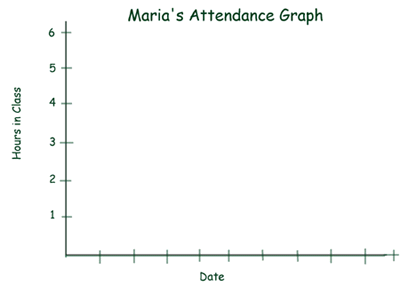
1. Create an empty graph for each student based on the sample below.

This graph can be a line graph or a bar graph. Hang each student's graph on a bulletin board in the class.
2. Create a second graph to display daily attendance for the entire class. This graph can display the dates along the horizontal axis and the number of students present on the vertical axis. Again, this graph can be a line graph or a bar graph.
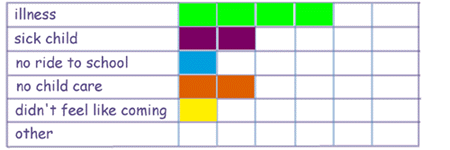
3. Next, have a chart for students to note the reason for any absence or lateness. Record the reasons for a month by having students color in a box beside the appropriate reason each time they are late or absent, as in the following sample. (Obviously, alter the reasons to reflect your student's situations.)

This creates a horizontal bar graph. (If you prefer, set it up as a typical bar graph. But note that this information cannot be graphed using a line graph since it does not measure one factor that varies over timešit just compares different quantities.)
After data has been collected for a month, have the students analyze it by asking questions such as:
Get creative, and ask away. You can even have students generate their own questions based on the data that they can swap with each other. The point is to analyze data that is directly related to them, to practice skills, and to talk about problem solving. If the interest is there, continue the graphs beyond a month and compare months.
Note that the data in the "reasons for being absent" graph/chart can be turned into a pie graph by entering the data into a graphing program such as the one included with MS Word and most desktop publishing programs. In fact, all of these graphs can be done on the computer as well as on paper, to enhance student's computer skills.
[Home]
[Introduction]
[Student-Centered Lessons]
[Worksheet intoActivity]
[Brain Teasers]
[List of Activities]
[Resources and Links]